
Financial Data
Indicators
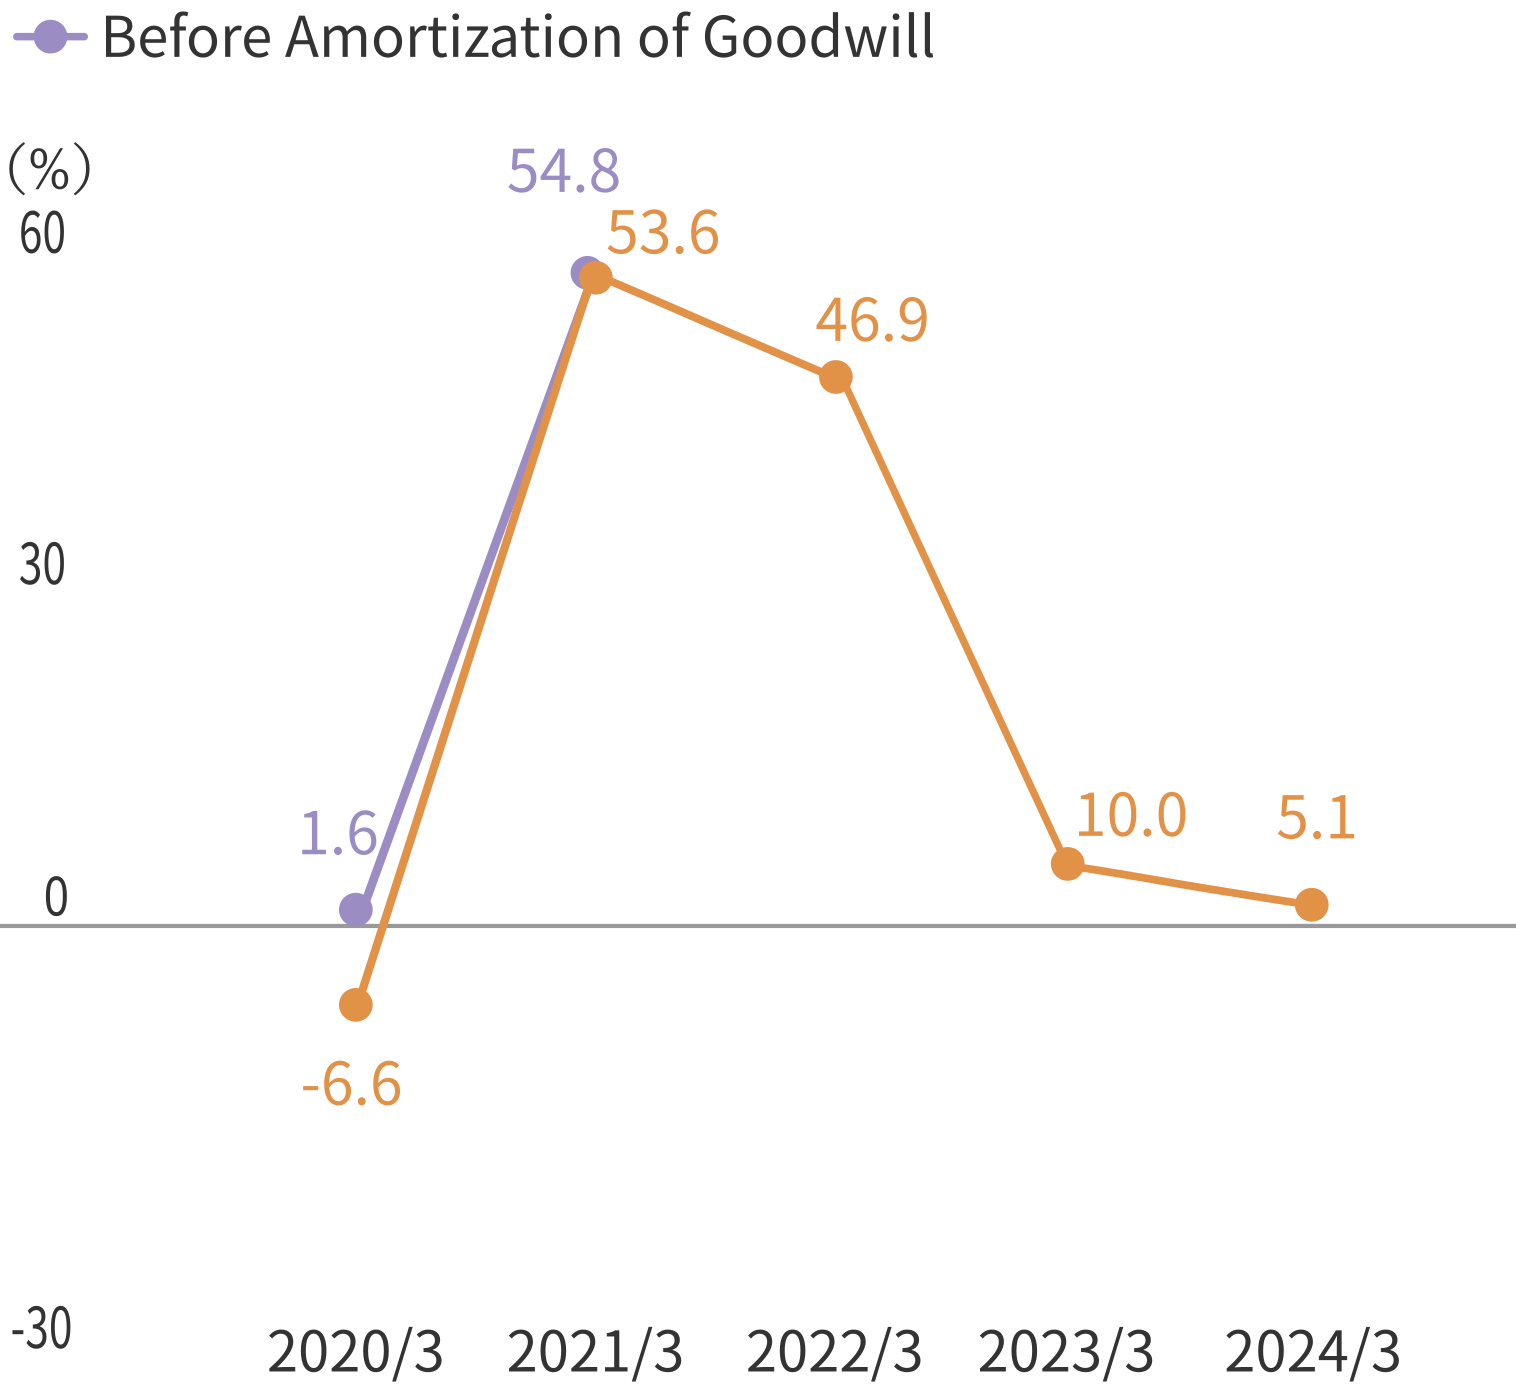
ROE
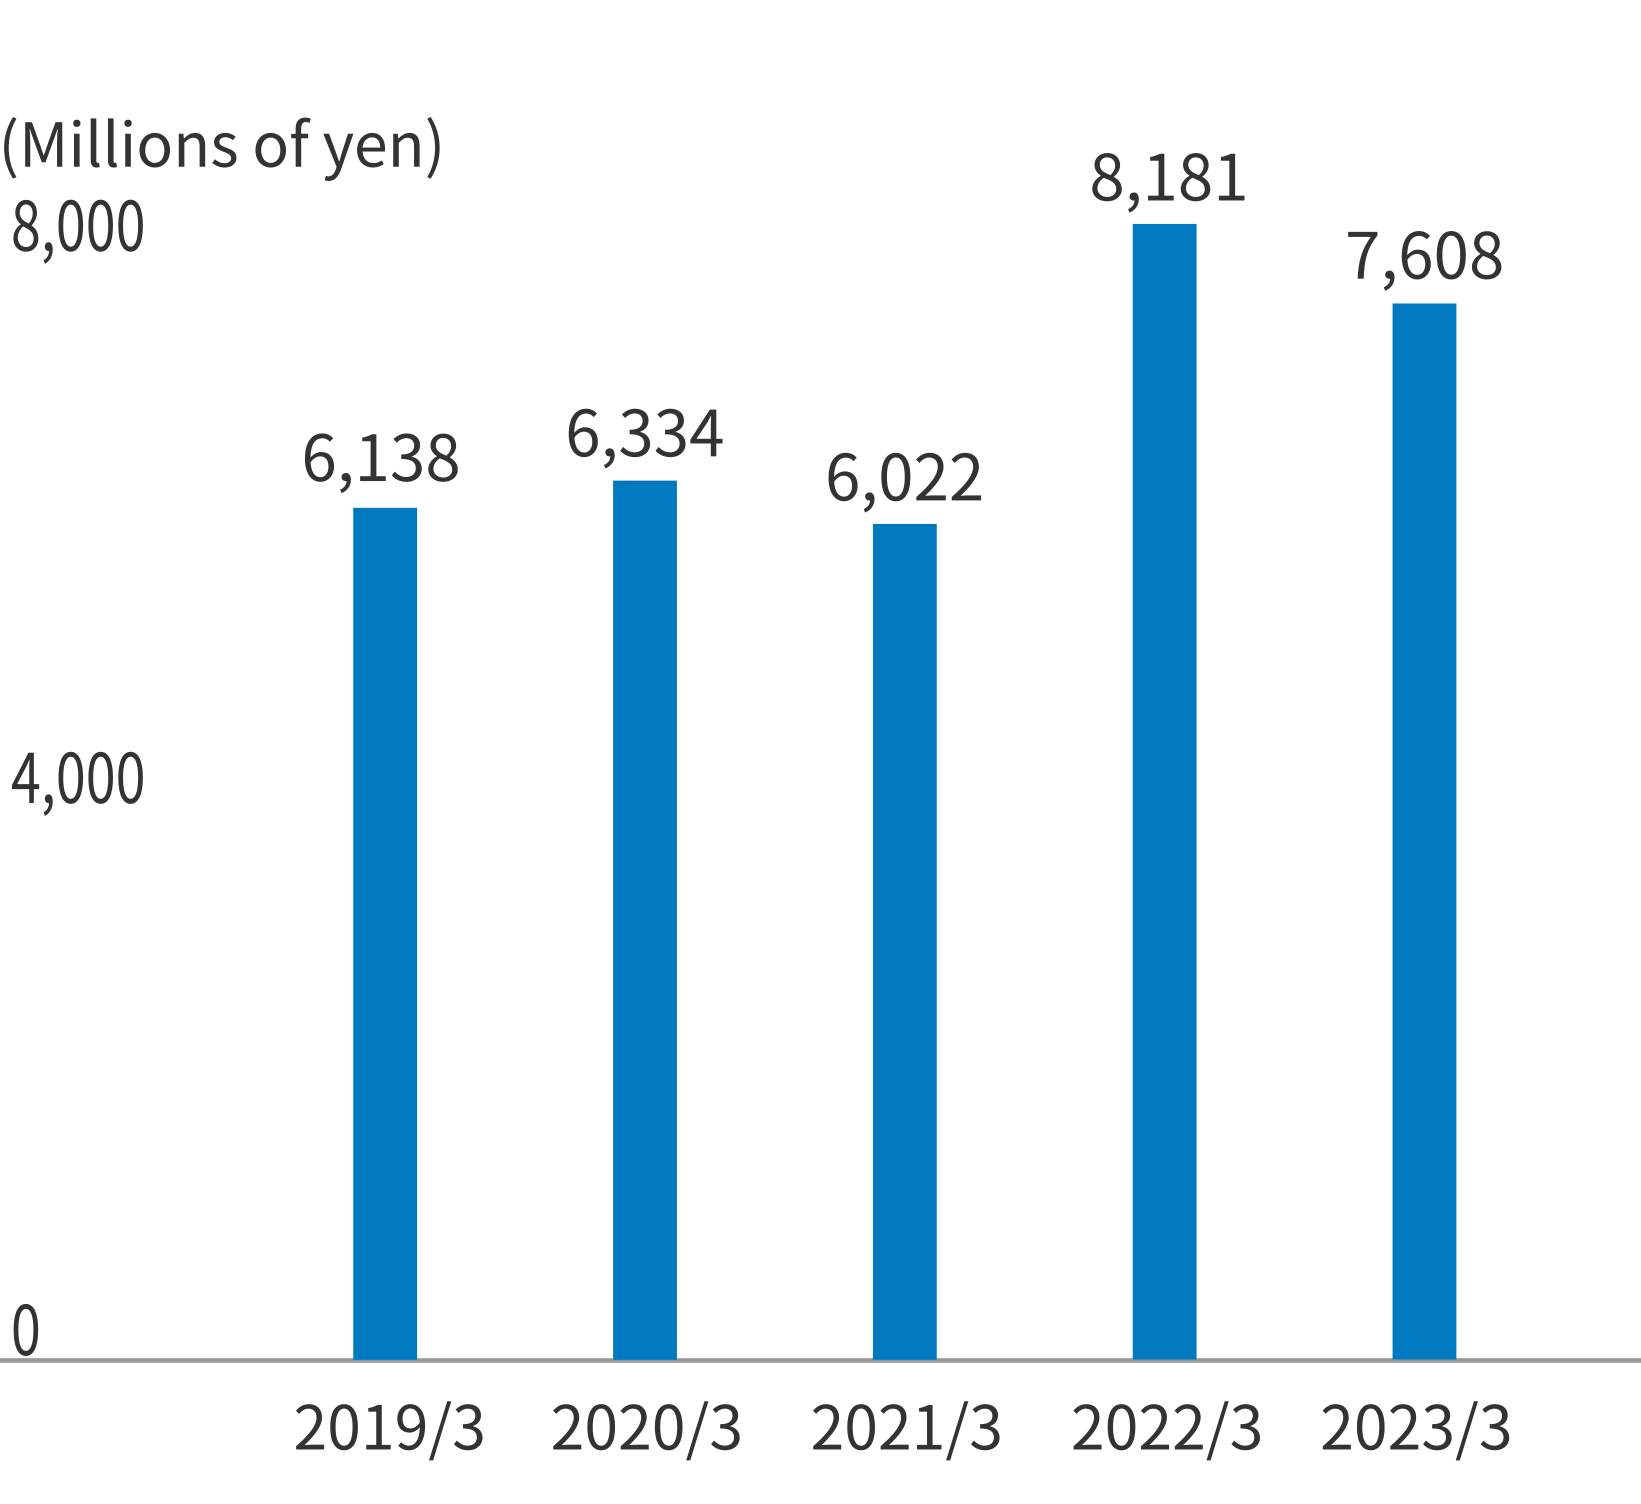
EBITDA
Management Analysis Indexes
| 2019/3 | 2020/3 | 2021/3 | 2022/3 | 2023/3 | |
|---|---|---|---|---|---|
| ROE (before amortization of goodwill) |
2.3% | 1.6% | 54.8% | - | - |
| ROE | -6.0% | -6.6% | 53.6% | 46.9% | 10.0% |
| ROA (before amortization of goodwill) |
0.7% | 0.5% | 29.1% | - | - |
| ROA | -1.9% | -2.2% | 28.5% | 33.5% | 7.9% |
| Sales to total assets ratio (Times) |
1.02 | 0.80 | 1.14 | 0.92 | 0.79 |
| EBITDA (Millions of yen) | 6,138 | 6,334 | 6,022 | 8,181 | 7,608 |
*1 ROE(before amortization of goodwill)=Profit attributable to owners of parent (before amortization of goodwill)÷Average shareholders' equity×100
*2 ROE=Profit attributable to owners of parent÷Average shareholders' equity×100
*3 ROA(before amortization of goodwill)=Profit attributable to owners of parent (before amortization of goodwill)÷Average total assets×100
*4 ROA=Profit attributable to owners of parent÷Average total assets×100
*5 Sales to Total Assets Ratio (times)=Net sales÷Average total assets
*6 EBITDA=Ordinary income+Interest expenses-Interest income+Depreciation+Amortization of goodwill
Related Links


