
Financial Data
Cash Flows
Free Cash Flow
Consolidated Statements of Cash Flows (Millions of yen)
| 2022/3 | 2023/3 | 2024/3 | 2025/3 | 2026/3 | |
|---|---|---|---|---|---|
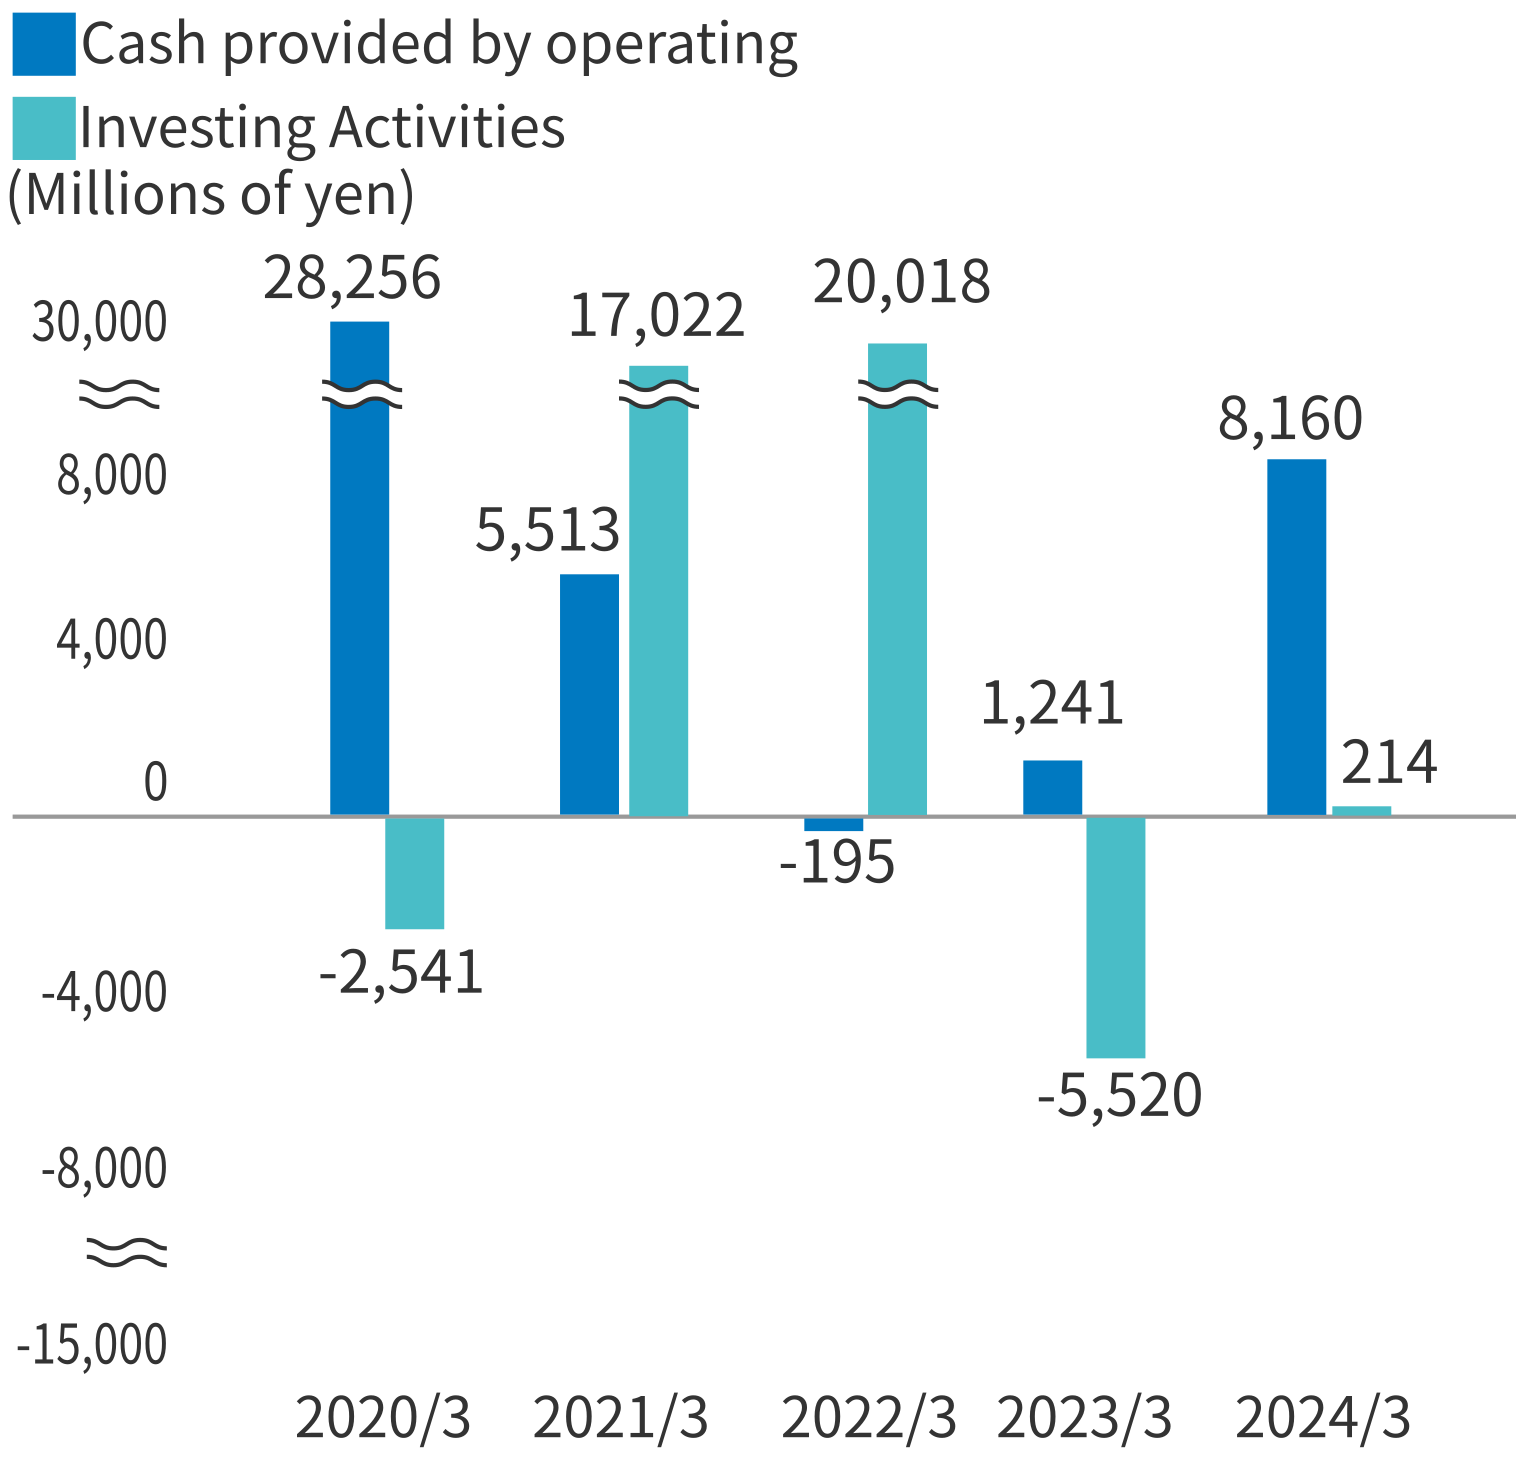
| Cash provided by operating activities | -195 | 1,241 | 8,160 | -3,726 | 5,297 |
| Cash provided by investing activities | 20,018 | -5,520 | 214 | 3,590 | 10,067 |
| Free cash flow | 19,823 | -4,279 | 8,375 | -136 | 15,364 |
| Cash provided by financing activities | -16,534 | -1,738 | -5,392 | -7,612 | -18,014 |
| Cash and cash equivalents at end of period | 25,769 | 20,717 | 25,160 | 17,547 | 15,321 |
*Free Cash Flow=Cash provided by operating activities+Cash provided by investing activities
Related Links


