
Financial Data
Per Share Indicators
Per Share Indicators
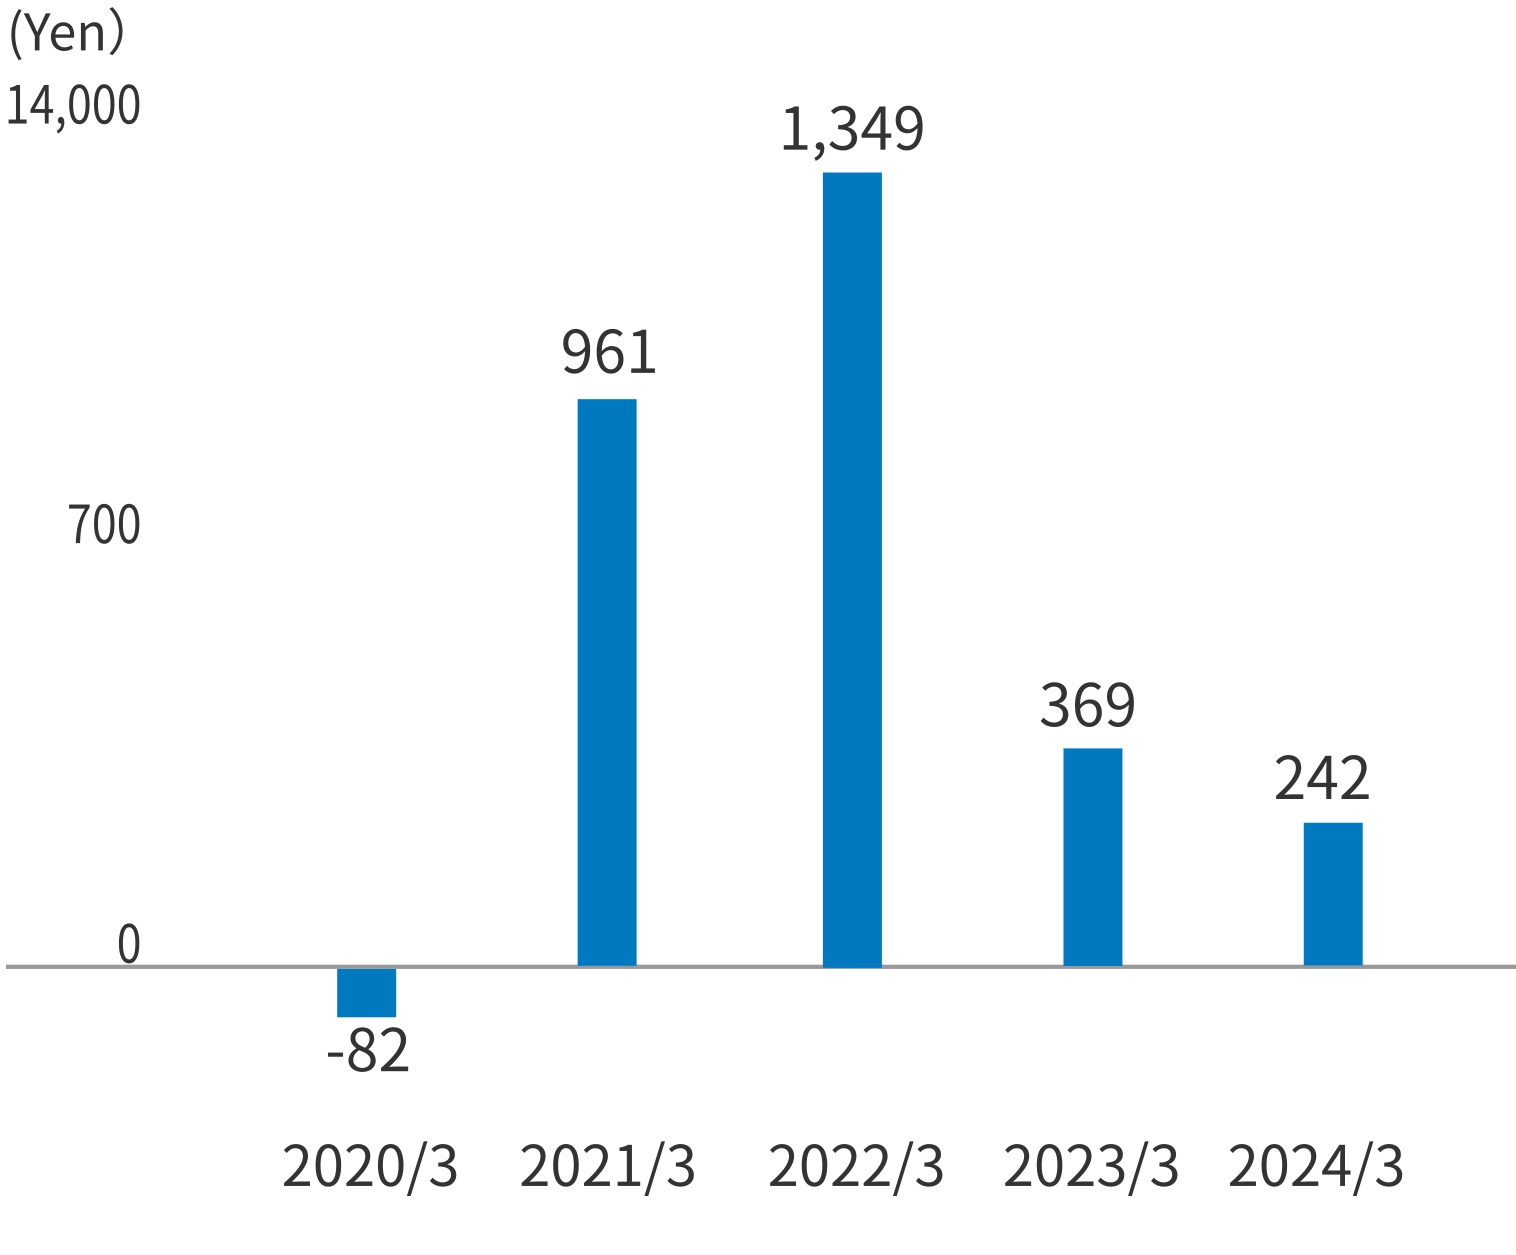
Per Share Indicators (Yen)
| 2021/3 | 2022/3 | 2023/3 | 2024/3 | 2025/3 | |
|---|---|---|---|---|---|
| Net income per share---basic | 961.28 | 1,349.01 | 369.40 | 242.30 | 306.27 |
| Net assets per share | 2,299.49 | 3,517.30 | 3,883.46 | 5,639.82 | 6,901.20 |
| Cash dividends per share | 80 | 90 | 90 | 110 | 140 |
| Payout Ratio | 8.3% | 6.7% | 24.4% | 45.4% | 45.7% |
*1 income per share=Profit attributable to owners of parent÷Average number of shares
*2 Net assets per share=Net assets÷Number of issued and outstanding shares at the end of fiscal year
*3 Payout Ratio=Cash dividends per share÷Net income per share×100
Related Links


