
Financial Data
Sales & Income
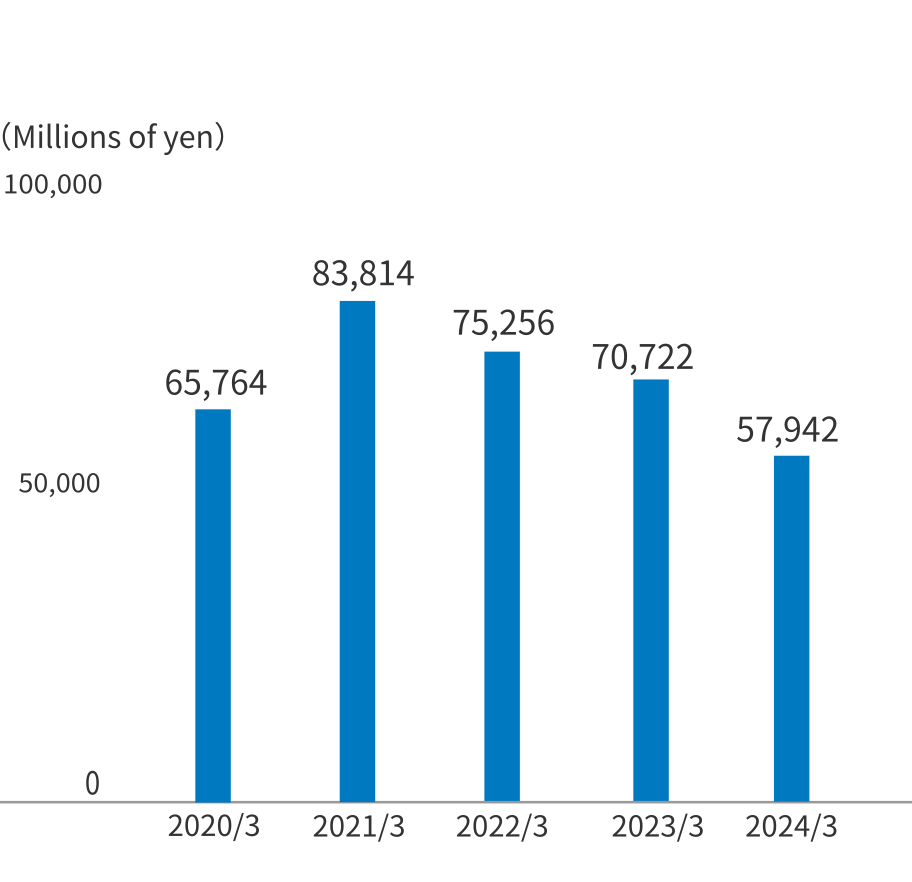
Net Sales
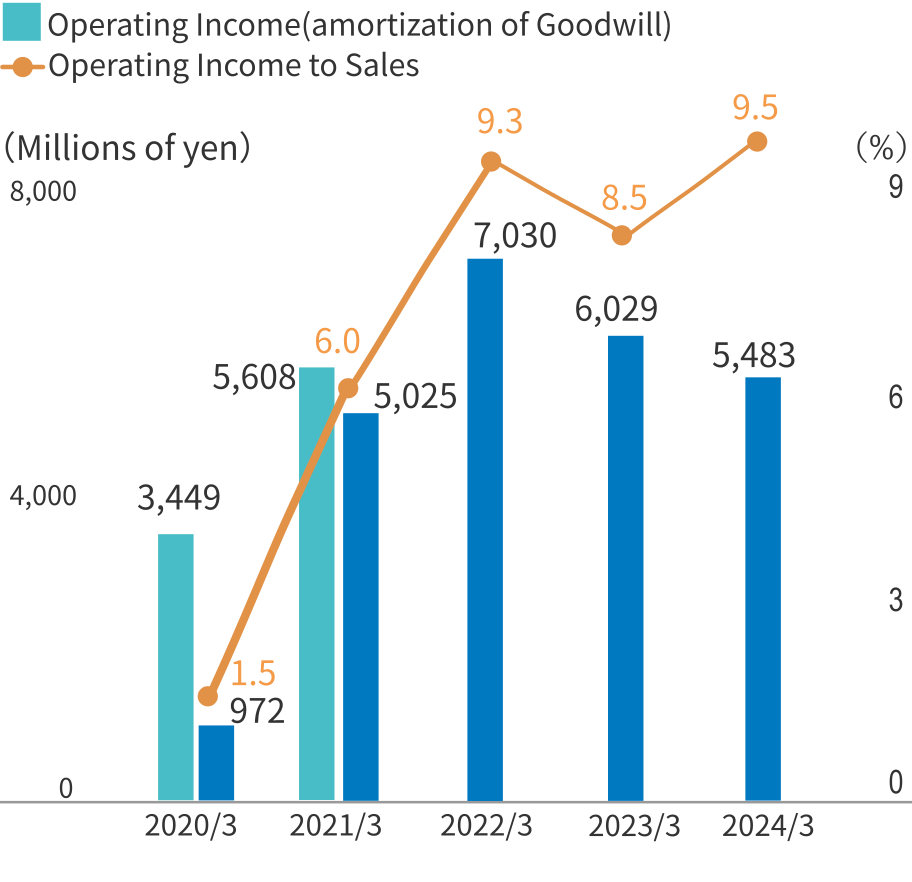
Operating Income and Operating Income to Sales
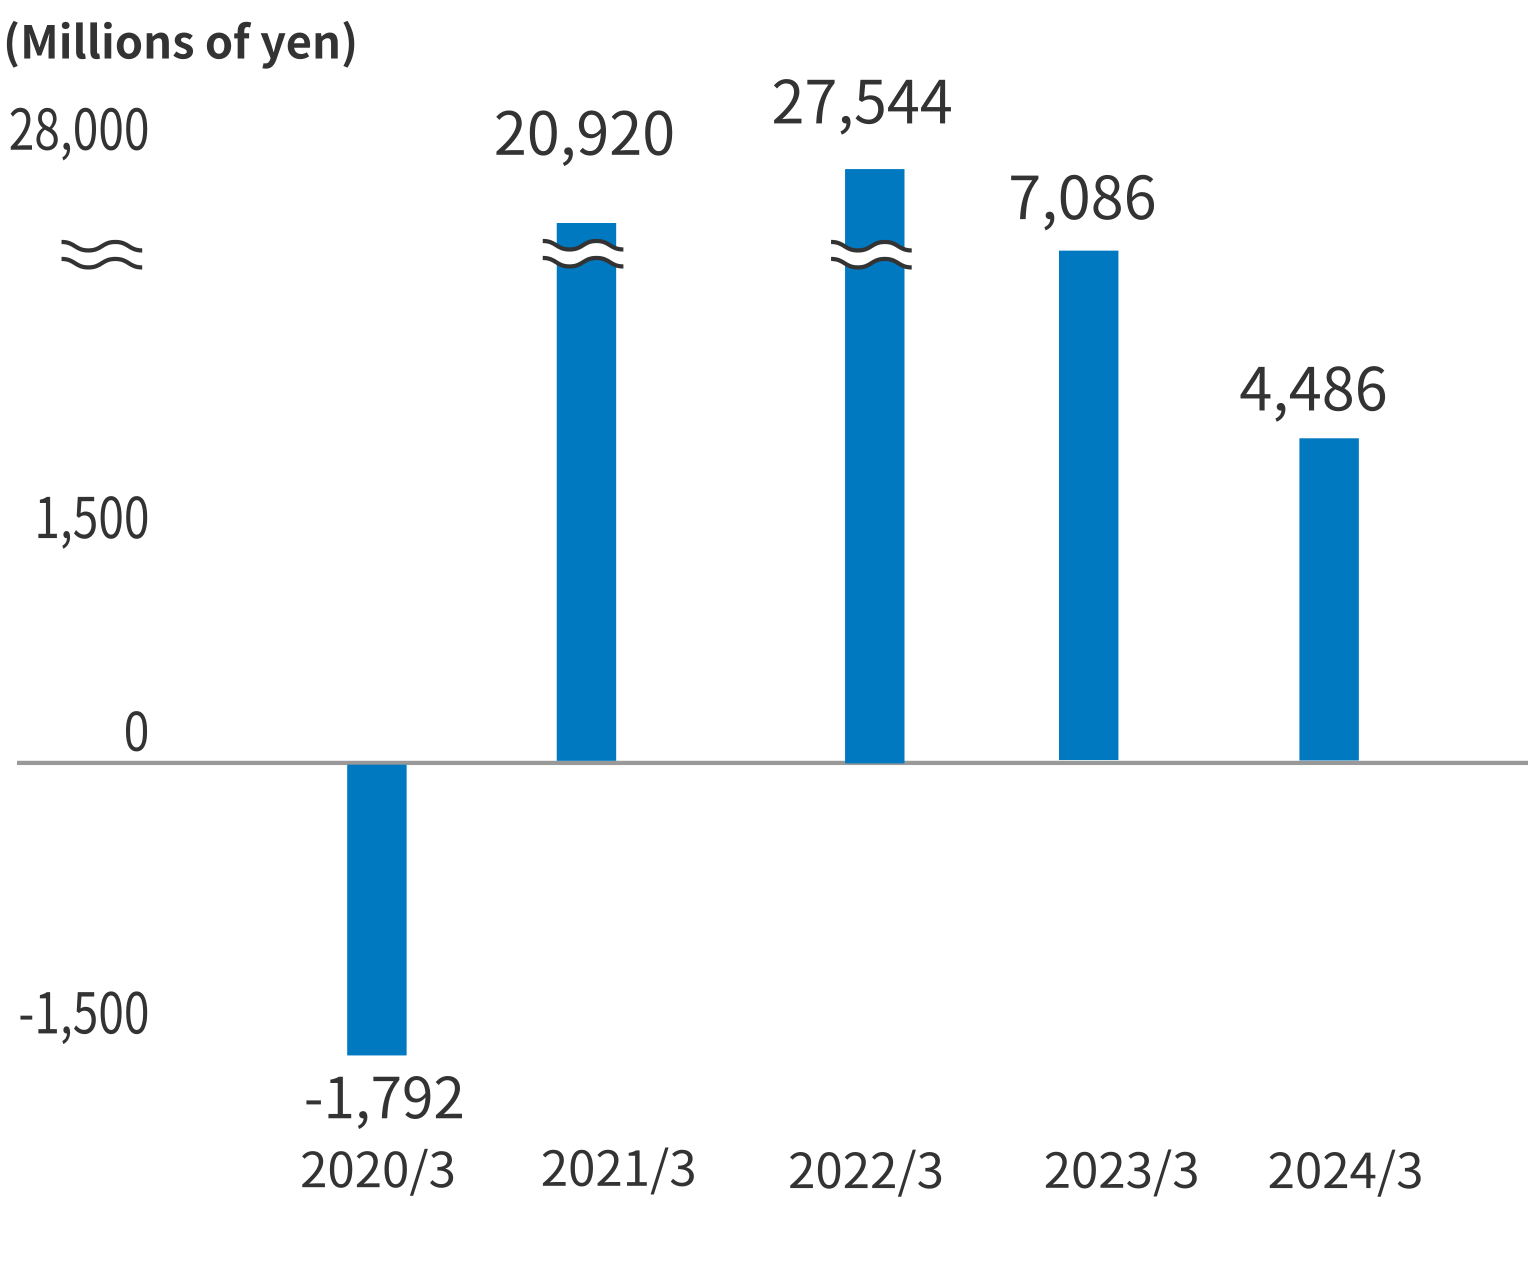
Profit Attributable to Owners of Parent
Consolidated Statements of Income (Millions of yen)
| 2021/3 | 2022/3 | 2023/3 | 2024/3 | 2025/3 | |
| Net sales | 83,814 | 75,256 | 70,722 | 57,942 | 42,326 |
| Cost of sales | 70,504 | 61,641 | 58,672 | 46,498 | 34,500 |
| Selling, general and administrative expenses | 8,285 | 6,584 | 6,020 | 5,961 | 5,636 |
| Operating income (before amortization of goodwill) |
5,608 | - | - | - | - |
| Operating income | 5,025 | 7,030 | 6,029 | 5,483 | 2,190 |
| Ordinary income | 3,912 | 7,857 | 7,311 | 3,456 | 2,608 |
| Profit attributable to owners of parent | 20,920 | 27,544 | 7,086 | 4,486 | 5,371 |
*1 In the fiscal year ended March 31, 2021, a gain on sales of shares of subsidiaries and affiliates of 26,387 million yen was recorded as extraordinary income.
*2 In the fiscal year ended March 31, 2022, a gain on sales of shares of subsidiaries and affiliates of 29,251 million yen was recorded as extraordinary income.
*3 In the fiscal year ended March 31, 2023, a gain on sales of shares of subsidiaries and affiliates of 3,467 million yen was recorded as extraordinary income.
*4 In the fiscal year ended March 31, 2024, a gain on sales of shares of subsidiaries and affiliates of 5,524 million yen was recorded as extraordinary income.
Profitability Indexes
| 2021/3 | 2022/3 | 2023/3 | 2024/3 | 2025/3 | |
|
Ratio of operating income (before amortization of goodwill) to sales |
6.7% | - | - | - | - |
| Ratio of operating income to sales | 6.0% | 9.3% | 8.5% | 9.5% | 5.2% |
| Ratio of net income to sales | 25.0% | 36.6% | 10.0% | 7.7% | 12.7% |
*1 Ratio of operating income (before amortization of goodwill) to sales=Operating income (before amortization of goodwill)÷net sales×100
*2 Ratio of operating income to sales=Operating income÷net sales×100
*3 Ratio of net income to sales=Profit attributable to owners of parent÷net sales×100
Related Links


